For students who don’t know a time when cell phones didn’t have the internet, it can be tough for them to appreciate just how recently the world became so deeply interconnected. Even the concept of “globalization” can be tricky to grasp since the transformation has largely already happened and did so before they were born.
But they do know exactly how the 2020 COVID-19 pandemic has been a sobering experience of this connectedness, as well as the “instantness” of all this connection. It will be one of the most defining experiences in how your students come to understand the world as young adults, but that doesn’t mean everything about this global village is to be feared or shunned. This event just happens to highlight its worst feature. There are a lot of great technological and knowledge advancements that have occurred as a result of globalization, as well as economic complexities that are great for students to explore.
If you do include this shared worldwide experience in your globalization unit, have it serve as an opportunity for students to process their personal experiences and share their perspectives in a safe classroom setting. I encourage you to talk about this event, as appropriate, with your students, which may mean different things the more years removed it becomes.
In my high school Global Issues class, we spend a few weeks looking at globalization using activities that speak to their 21st century life experiences and what the future of globalization, consumption, and natural resources means for them.
The driving question of our globalization unit asks students, “is the world shrinking or expanding?” It’s powerful for them since this is one of the first times they have been challenged to learn about the future.
If you want to check out our unit, here is a detailed preview you can view.
Because this unit makes my students see the world in such a new way, I want to share a few of the most powerful activities I use—ones that will stick with your students, too, as they leave your classroom each year.
Explore Powerful Data Graphs
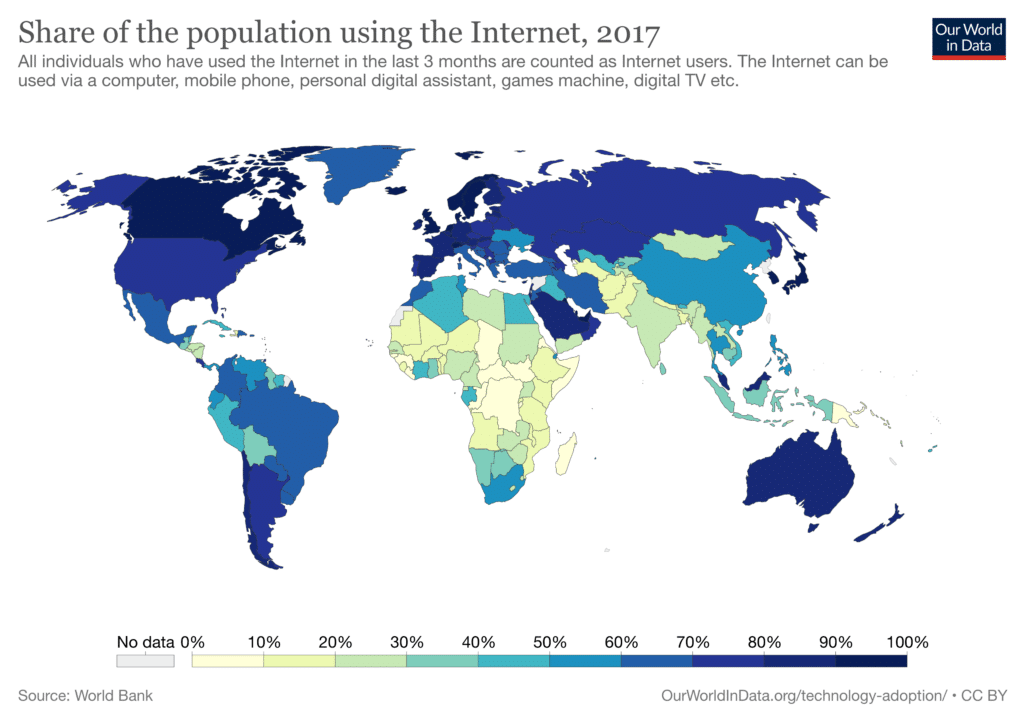
The World in Data, created by the University of Oxford’s Martin Programme of Global Development, is a fantastic database of over 3,000 beautiful charts and maps, many interactive, on nearly 300 topics. Every demographic and environmental measurement imaginable is included and compared across the nations of the world; from life expectancy, to internet access, to energy consumption. And they are displayed in easy-to-understand color graphics that are perfect for middle and high school students to explore.
The best part is how many of their graphs are interactive so the data can be examined over time, which is crucial for students to see globalization happening.
The map above comes from their Technology Adoption collection and displays Internet accessibility data from 1990 to 2017. The data also can be viewed in line graphs by country.
All of these maps and graphs are downloadable as image files to insert into your worksheets or presentation files, or you can have students use the website themselves by assigning each a certain graph or collection of graphs to independently examine and teach to the rest of the class.
This website is an absolute goldmine for global studies or world geography teachers and a must when teaching about globalization issues.
Uncover Open Courseware
I have never had a student know what open courseware was at the beginning of our globalization unit, but afterwards I don’t think a single one will forget it!
While students have all heard of or even use free web-based educational tools like Kahn Academy and Crash Course, they have probably never truly thought about the impact all this free, high-quality education can have on the flattening of the world’s economy. And open courseware is coming from some of America’s and the world’s top universities.
The concept was spearheaded in 2001 by MIT and now most major universities have an open courseware section somewhere on their website. After introducing the concept to my students and exploring MIT’s expansive offerings, I assign each student another university’s open courseware to explore on their own, tasking them to find one course offering that sounds interesting to them and share out.
We end with a discussion with some heavy and very intriguing questions about the meaning of a college degree, what access to the internet truly means now, about how they choose to spend their free time, and what competition could mean for college and employment spots.
Another website I love showing my students is Lynda. Most public libraries allow patrons to access its classes for free with their library card. Here, students (and you!) have access to thousands of software, design, and photography courses.
Contrast Starkly Different High School Experiences
2 Million Minutes is the perfect film to show right after students have explored open courseware websites. Its premise is simple: two million minutes is about four years—the length of high school.
This film, which showcases six high-achieving teens, two each from China, India, and the United States, is exactly that—the story of the high school experience in these three countries.
I do heavily preface this film before we start watching it, and I encourage you do to the same, because no two sample students could ever fairly represent the tens and hundreds of millions of teenagers from these three largest nations, and this film does paint the students in a fairly predictable way.
Your students likely already have some awareness of the stereotypes that college-bound Chinese and Indian students study far more than they do. So challenge your students to dig deeper. Challenge your students to watch for the different values demonstrated by each culture and what this means for the future of job competition as the economy becomes more and more globalized.
And even though students aren’t usually blown away by the comparisons made in the film, the experts’ commentary and included statistics do serve as a bit of a wakeup call after students have just explored all that college-level coursework available online for free.
This film is just under an hour and is available for streaming and on DVD through Amazon.
Click here to check out some more of my favorite Global Issues films and learn how I use them in class, too.
Track the Hidden Journey of a T-Shirt

In 1960, about 95% of the clothing Americans owed was made in the United States. Today, it’s closer to 2%.
Show these numbers to your students before having them twist and turn to check out the country of manufacture for the clothes they are wearing. You can explore the story behind those stats and few more related facts using an interactive graphic from KQED.
Afterwards, have your students follow the journey of a single t-shirt from the cotton fields of the American south, to faraway garment factories in developing countries, then back to the United States. NPR’s fantastic podcast Planet Moneycreated a quite engaging website, Planet Money Makes a T-Shirt, that’s part documentary, part infographic, part written article.
You can have students watch it together as a class or work through the segments independently.
I highly suggest having a world map displayed somewhere so students can visually track all the locations the shirts travel to before arriving at the doorsteps of an American home.
Calculate One’s Own Eco-Footprint
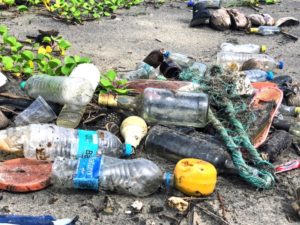
After looking at all the advancements of globalization, you should spend time exploring the impact all this rapid economic growth has had on natural resources and end with students calculating their own personal eco-footprint.
This activity really hits home with students, like the t-shirt activity above, that their everyday possessions and lifestyle are tightly woven into the global economy and their choices are impacting the current and growing strain on global natural resources.
While there are several calculators out there, The Global Footprint Network’s footprint calculator is my go-to for students.
It’s animated with just the right amount of customization to be personal, but not get your students caught up in extra details. Note: this one does ask for an email address, but students can type anything to immediately start using the calculator.
In our unit on sustainability we complete a few more activities that specifically calculate water and food eco\-footprints, and you can read all about how we use those, too!
I hope these doable lesson ideas help you make the concept of globalization more real for your students!
To grab already-done lessons with these ideas and more, check out my complete Globalization PBL unit kit!
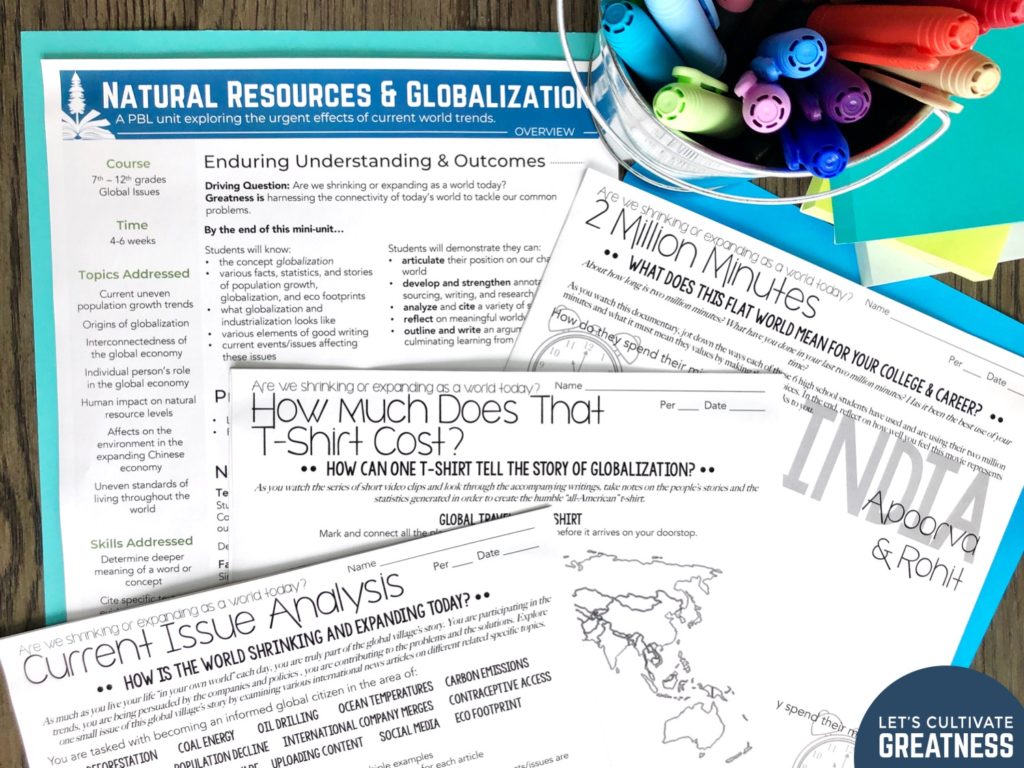
Image photo credits: Kyle Glenn, Our World in Data, Claudia Wolff, Kesgan Henman